Last Updated on December 13, 2013 3:00 pm
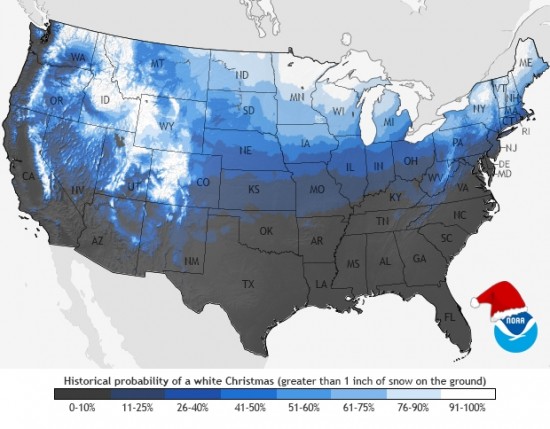
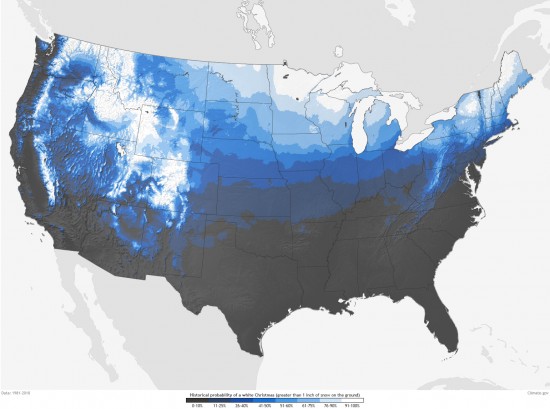
The maps below shows the historic probability of there being at least 1-inch of snow on the ground in the Lower 48 states on December 25 based on the latest (1981-2010). Maps: NOAA
Below is data from the State Climate Office showing local NWS Cooperative stations that measured snowfall from Dec 24-26 of the stated year.
*All data from State Climate Office Of North Carolina*
Boone
Year Total Snowfall Observed December 24-26
(inches)
1930 1
1935 2.5
1938 5.5
1939 12
1945 2
1947 1
1948 4
1960 0.5
1961 3
1962 2.5
1963 1
1965 2.5
1966 6
1968 0.5
1969 16
1970 1.5
1975 1.5
1976 0.5
1979 3
Frequency of a White Christmas 19 out of 51 (0.373)
Boone 1 Se station
Year Total Snowfall Observed December 24-26
(inches)
1983 0.5
1985 3
1989 1
1992 1.5
1993 3
1995 2
2007 0.10000000149011612
2009 0.30000001192092896
2010 4
Frequency of a White Christmas 9 out of 32 (0.281)
Blowing Rock 1nw
Year Total Snowfall Observed December 24-26
(inches)
1912 3
1945 2
1947 1.300000011920929
1948 3
1960 0.5
1962 2
1963 1
1966 4.899999916553497
1969 14
1975 0.5
1976 2
1981 9
1983 1.399999976158142
1989 0.30000001192092896
1992 0.30000001192092896
1993 2
2007 0.10000000149011612
Frequency of a White Christmas 17 out of 61 (0.279)
Banner Elk
Year Total Snowfall Observed December 24-26
(inches)
1907 0.5
1908 6
1909 10
1913 2
1915 3
1930 1
1933 0.30000001192092896
1935 4.5
1938 3.5
1939 1
1944 2.0999999046325684
1945 2.5
1948 4
1961 1.5
1962 3
1968 1
1969 16.900000005960464
1970 1
1975 1.4999999552965164
1979 1
1981 7
1985 4.5
1993 5
1995 2.4000000059604645
2002 3.300000011920929
2003 0.20000000298023224
2005 1
2010 5.100000001490116
Frequency of a White Christmas 28 out of 104 (0.269)


