

Last Updated on February 13, 2022 9:03 am
“Access to medical services is crucial to being healthy, but research shows that more than 70 percent of a person’s overall health is driven by social and environmental factors outside the health care system,” said State Health Director and DHHS Chief Medical Officer Betsey Tilson, M.D., MPH. “Identifying and codifying the areas of disparities in these indicators will help to inform community needs assessments and program planning.”
Dr. Tilson said it can also guide community investments and facilitate integration and enhance partnerships between health care and community organizations.
“Ultimately, we envision a North Carolina that optimizes health and well-being for all by effectively stewarding our collective resources to unite our communities and health care systems,” said DHHS Secretary Mandy Cohen, M.D. “After all, no matter what our respective goals — to mitigate the opioid crisis, to ensure our children are healthy, safe and ready to learn, to increase employment or to drive economic growth — it all begins with healthy people. To have a healthy and productive state, we need to focus on all components of what drives health.”
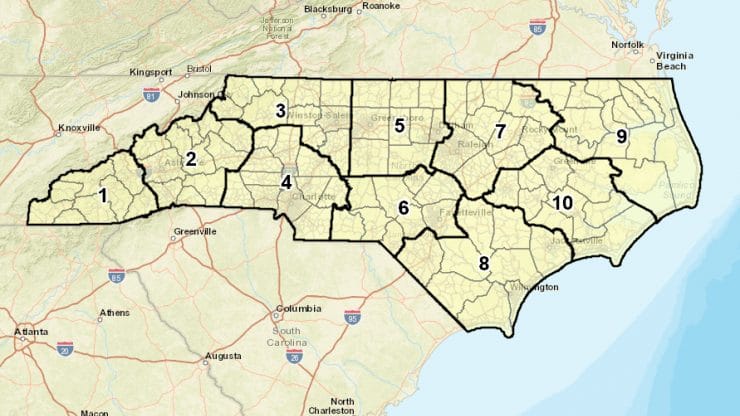
The map is organized by local health department region and is tabulated at the census-tract level. Data comes from the U.S. Census Bureau’s 2016 American Community Survey 5-year Estimates and the U.S. Department of Agriculture’s Food and Nutrition Service.
Economic conditions are described in the map using several metrics, including median household income, percent of people living below poverty and percent of people who are uninsured. Housing and transportation conditions are described by metrics such as percent of households spending more than 30 percent of income on housing, percent of people living in an overcrowded household and percent of households without a vehicle. Social and neighborhood conditions are described by metrics that include education level, percent of households with low access to healthy foods and areas identified as food deserts. A cumulative index is calculated from the metrics to provide an overall measure of social determinants of health indicators.
“This will be a powerful tool for our communities and state as we strive to improve the health and well-being of all North Carolinians,” said Eleanor Howell, M.S., director of the State Center for Health Statistics.
Added Pryor Gibson, director of the Governor’s Hometown Strong Initiative: “DHHS has always been North Carolina’s best rural partner and asset in helping our communities improve health, families and lives. With this effort, they have added an incredible tool to build success for generations to come.”