

Last Updated on February 13, 2022 8:46 am
The calendar year 2018 is now officially the wettest year on record for Boone, Watauga County, and the High Country.
93.42 inches of precipitation was recorded officially for Boone at the Boone 1 SE weather station. That breaks the previous mark of 82.79 inches, recorded in 1979, by 10.63 inches. 76.36 inches in 1949 is now the third overall tally since weather records for Boone started in 1929. The normal precipitation total is 52.66 inches, with the lowest of 39.37 inches in 1943 and 39.38 inches in 1981.
195 days out of 365 recorded precipitation for 2018 at the Boone 1 SE station.
Weather records for Boone have been kept by three different official weather stations since 1929. The reporting station from 1929 to 1980 has some years with incomplete/missing data which could mean much higher totals. As an example, the year of the great flood, 1940 yearly total only shows 56.97 inches. 77 days of data are missing for that year. The Boone 1 SE reporting station is the current official station for precipitation and temperature records and has been recording data since June 1980. The Watauga Medical Center reporting station is used for wind records.
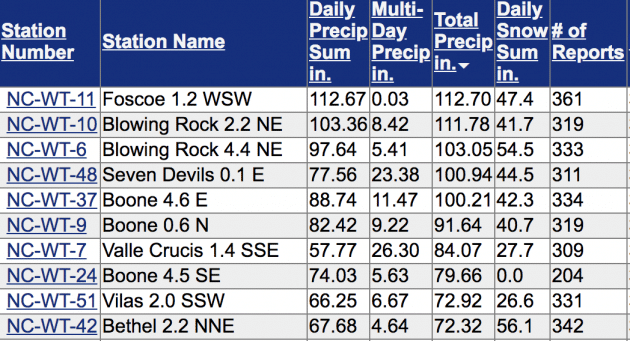
Just like with other weather events, totals across the county varied. Several of the Community Collaborative Rain, Hail and Snow Network reporting stations, better known as CoCoRaHS, recorded over 100 inches. The Foscoe 1.2 WSW station reported 112.70 inches, the Blowing Rock 2.2 NE station reported 111.78 inches, the Blowing Rock 4.4 NE station reported 103.05 inches, the Seven Devils 0.1 station reported 100.94 inches and the Boone 4.6 E station reported 100.21 inches.
From January 1, 2000, until December 31, 2018, the Boone 1 SE weather station has recorded 1129.05 inches of precipitation. 571.58 inches of which was recorded from January 1, 2010, to December 31, 2018, and 406.21 inches of that between January 1, 2013, and December 31, 2018.
Below is a monthly breakdown of days with precipitation of at least a trace, including the number of specific days with recorded precipitation from the Boone 1 SE weather station.
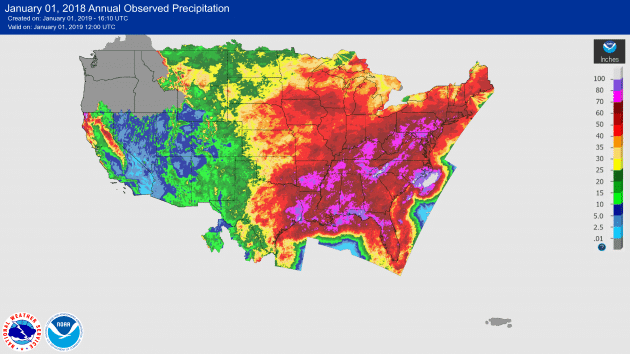
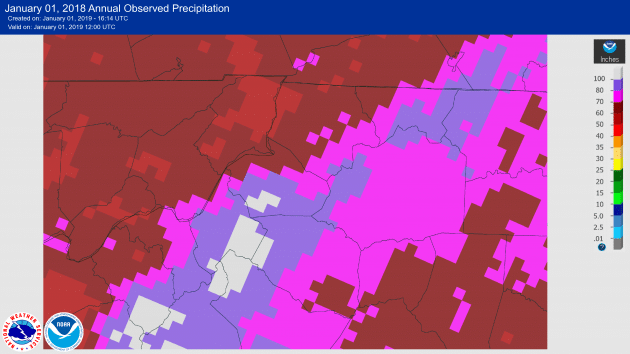
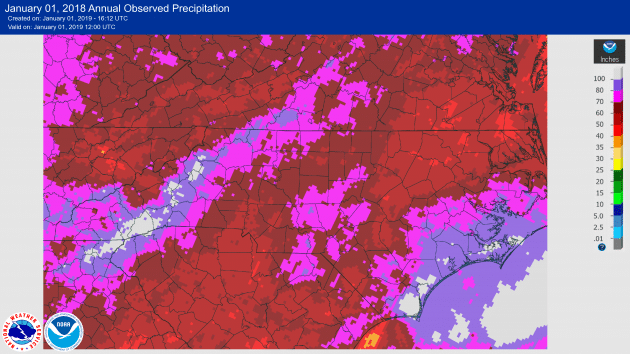
At the end of the breakdown are graphics from the National Weather Service showing rainfall data for 2018.
Month – Number of days new precipitation was measured – total monthly inches – most in one day
January – 13 out of 31 days for 4.77 inches – 3 inches on Friday, January 12
Monday – 2 out of 5
Tuesday – 3 out of 5
Wednesday – 1 out of 5
Thursday – 3 out of 4
Friday – 2 out of 4
Saturday – 1 out of 4
Sunday – 1 out of 4
February – 18 of 28 days for 3.93 inches – 1.30 inches on Sunday, February 11
Monday – 4 out of 4
Tuesday – 3 out of 4
Wednesday – 2 out of 4
Thursday – 2 out of 4
Friday – 2 out of 4
Saturday – 2 out of 4
Sunday – 3 out of 4
March 19 of 31 days for 4.33 inches – 1.25 inches on Sunday, March 25
Monday – 1 out of 4
Tuesday – 4 out of 4
Wednesday – 3 out of 4
Thursday – 4 out of 5
Friday – 3 out of 5
Saturday – 1 out of 5
Sunday – 3 out of 4
April 15 out of 30 days for 9.64 inches – 3.94 inches on Tuesday, April 24
Monday – 3 out of 5
Tuesday – 3 out of 4
Wednesday – 2 out of 4
Thursday – 2 out of 4
Friday – 1 out of 4
Saturday – 2 out of 4
Sunday – 2 out of 5
May 17 of 31 days for 13.39 inches – 3.40 inches on Saturday, May 19
Monday – 2 out 4
Tuesday – 3 out of 5
Wednesday – 3 out of 5
Thursday – 2 out of 5
Friday – 2 out of 4
Saturday – 2 out of 4
Sunday – 3 out of 4
June 14 out of 30 days for 4.11 inches – 1.55 on Thursday, June 14
Monday – 3 out of 4
Tuesday – 2 out of 4
Wednesday – 1 out of 4
Thursday – 2 out of 4
Friday – 2 out of 5
Saturday – 1 out of 5
Sunday – 3 out of 4
July 14 out of 31 days for 4.36 inches – 0.78 inches on Saturday, July 7
Monday – 4 out of 5
Tuesday – 3 out of 5
Wednesday – 2 out of 4
Thursday – 0 out of 4
Friday – 1 out of 4
Saturday – 2 out of 4
Sunday – 2 out of 5
August 17 out of 31 days for 10.74 inches – 1.64 on Saturday, August 4
Monday – 2 out of 4
Tuesday – 3 out of 4
Wednesday – 3 out of 5
Thursday – 3 out of 4
Friday – 1 out of 5
Saturday – 3 out of 4
Sunday – 2 out of 4
September 18 out of 30 days for 10.77 inches – 5 inches on Monday, September 17
Monday – 4 out of 4
Tuesday – 3 out of 4
Wednesday – 3 out of 4
Thursday – 2 out of 4
Friday – 1 out of 4
Saturday – 2 out of 5
Sunday – 3 out of 5
October 15 out of 31 days for 11.13 inches – 5.24 inches on Thursday, October 11
Monday – 3 out of 5
Tuesday – 3 out of 5
Wednesday – 2 out of 5
Thursday – 1 out of 4
Friday – 2 out of 4
Saturday – 1 out of 4
Sunday – 3 out of 4
November 19 out of 30 for 5.96 inches -1.43 inches on Friday, November 16
Monday – 2 out of 4
Tuesday – 4 out of 4
Wednesday – 3 out of 4
Thursday – 1 out of 5
Friday – 4 out of 5
Saturday – 4 out of 4
Sunday – 1 out of 4
December 16 out of 31 days for 10.29 inches – 2.43 inches on Friday, December 21
Monday – 3 out of 5
Tuesday – 1 out of 4
Wednesday – 1 out of 4
Thursday – 1 out of 4
Friday – 3 out of 4
Saturday – 4 out of 5
Sunday – 3 out of 5
2018 Observed rainfall Watauga County and the High Country

2018 Observed rainfall for North Carolina
2018 Observed rainfall nationwide